
# ggplot 라이브러리 설치 및 임포트
install.packages("ggplot2")
library(ggplot2)
# 실행 결과 새창에 띄우기
x11()
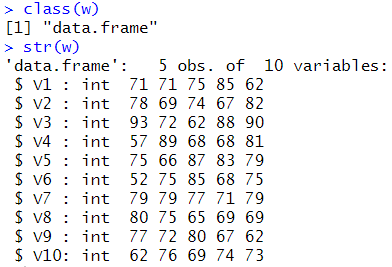
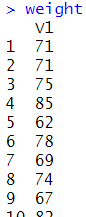
사용 데이터셋 형식 변경
|
# 원본 weight <- read.table("C:/data/weight_1.txt",header=F) class(w) |
 |
|
# 데이터 프레임의 행렬수를 바꾸기 위해 매트릭스 형식으로 미리 바꾼다. weight <- as.matrix(w) dim(weight) <- c(50,1) |
 |
|
# ggplot은 데이터 프레임 형식이 아니면 오류가 나기 때문에 다시 데이터 프레임 형식으로 바꾼다. weight <- as.data.frame(weight) |
 |
1. 히스토그램
|
# 그래프 배경 그리기 ggplot(weight,aes(x=weight[,1])) |
 |
|
# 기본 사용법 ggplot(weight,aes(x=weight[,1]))+ |
 |
|
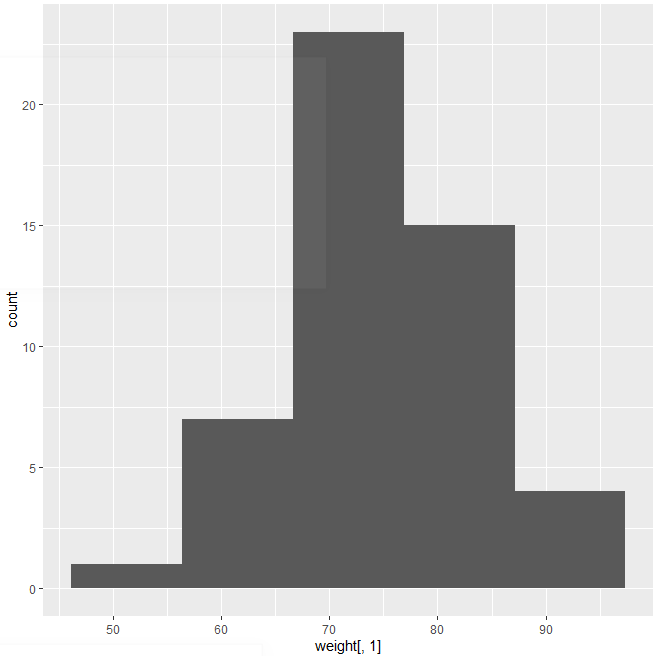
# bins를 설정해서 빠진 구간이 없게 하자 ggplot(weight,aes(x=weight[,1]))+ geom_histogram(bins=5) |
 |
|
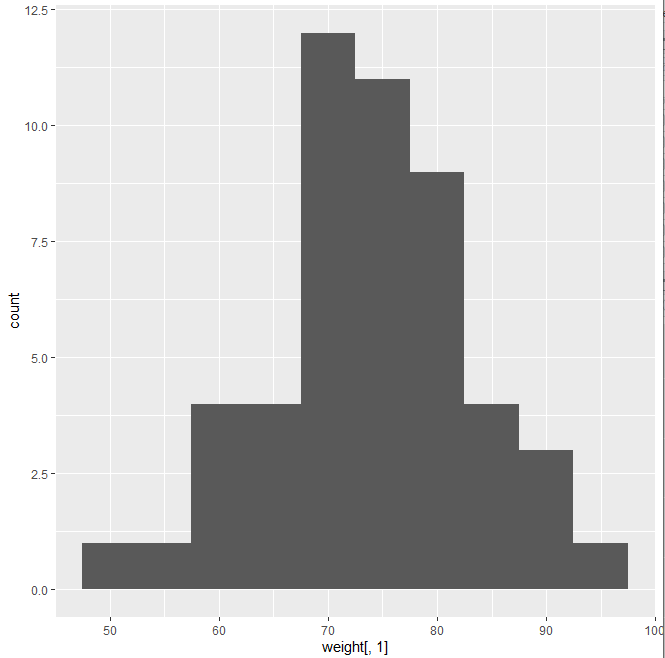
# bins 개수가 많으면 binwidth는 좁다 ggplot(weight,aes(x=weight[,1]))+ geom_histogram(binwidth=5) |
 |
|
# bins 개수가 적으면 binwidth는 넓다 ggplot(weight,aes(x=weight[,1]))+ geom_histogram(binwidth=10) |
 |
|
# 색채우기 ggplot(weight,aes(x=weight[,1]))+ geom_histogram(binwidth=10,aes(fill=..count..)) |
 |
|
# 수동으로 색 체우기 ggplot(weight,aes(x=weight[,1]))+ geom_histogram(binwidth=10,aes(fill=..count..), fill="blue",colour="black") |
 |
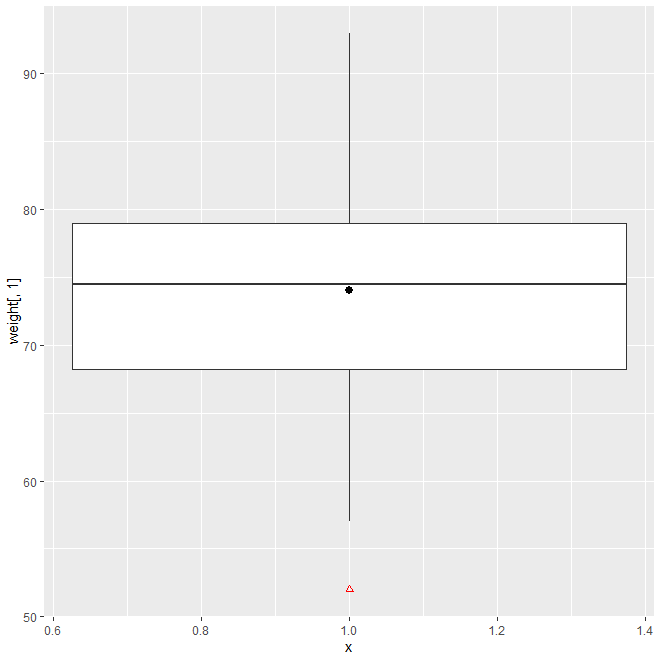
2. 상자 그림
|
# 기본 사용법 ggplot(weight,aes(x=1,y=weight[,1]))+ geom_boxplot() |
 |
|
# 이상치 설정 바꾸기 ggplot(weight,aes(x=1,y=weight[,1]))+ geom_boxplot(outlier.color = "red", outlier.shape = 2) |
 |
|
# 이상치 제거 ggplot(weight,aes(x=1,y=weight[,1]))+ geom_boxplot(outlier.shape = NA) |
 |
|
# 평균값 보기 ggplot(weight,aes(x=1,y=weight[,1]))+ geom_boxplot(outlier.color = "red", outlier.shape = 2)+ stat_summary(fun.y="mean") |
 |
|
# 평균값 꾸미기 ggplot(weight,aes(x=1,y=weight[,1]))+ geom_boxplot(outlier.color = "red", outlier.shape = 2)+ stat_summary(fun.y="mean",geom="point",shape=22, size=3,fill="blue") |
 |
'컴퓨터 > R' 카테고리의 다른 글
| R - stringr을 이용한 텍스트 정제 작업 (0) | 2020.04.23 |
|---|---|
| R - wordcloud (0) | 2020.04.23 |
| R - 시각화 ④ ggplot 라이브러리 사용(막대그래프) (0) | 2020.04.22 |
| R - 시각화 ③ box plot, Stem and Leaf Diagram (0) | 2020.04.22 |
| R - cut (0) | 2020.04.21 |