
# ggplot 라이브러리 설치 및 임포트
install.packages("ggplot2")
library(ggplot2)
# 실행 결과 새창에 띄우기
x11()
1. 막대그래프
1.1 ggplot() : 그래프 배경 그리기
|
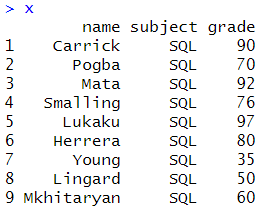
# 파일 불러오기 및 변수에 저장 df <- read.csv("C:/data/exam.csv",header=T, x <- df[df$subject=="SQL",] |
 |
|
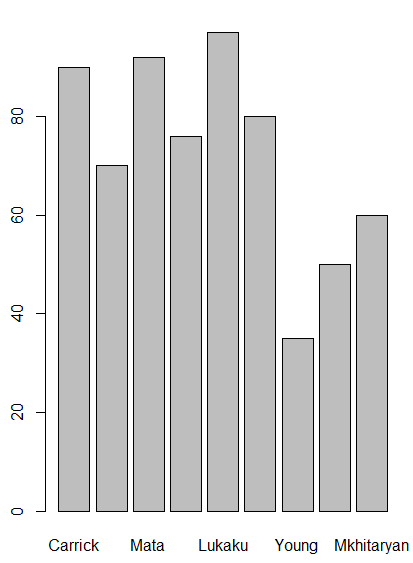
# 일반 parblot을 사용한 막대그래프 그리기 barplot(x$grade,names.arg=x$name) |
 |
|
# ggplot을 사용한 그래프 배경 생성 ggplot(x,aes(x=name,y=grade)) |
 |
1.2 geom_bar() : 막대그래프 그리기
|
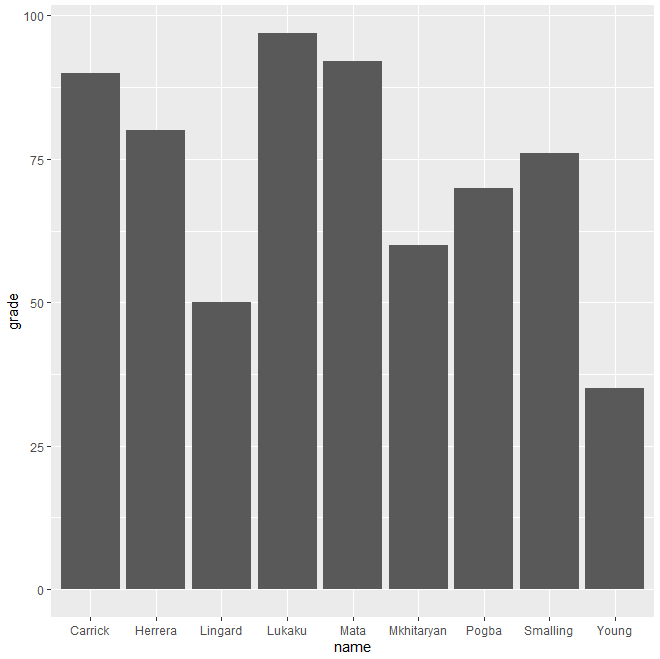
# geom_bar() : 막대그래프 그리기 ggplot(x,aes(x=name,y=grade))+ geom_bar(stat="identity") |
 |
|
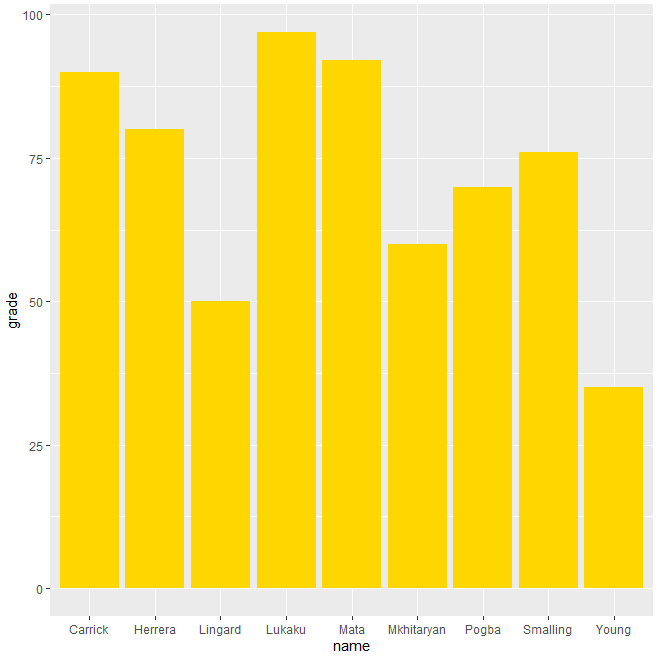
# bar에 색깔 채우기 ggplot(x,aes(x=name,y=grade))+ geom_bar(stat="identity",fill="gold") |
 |
|
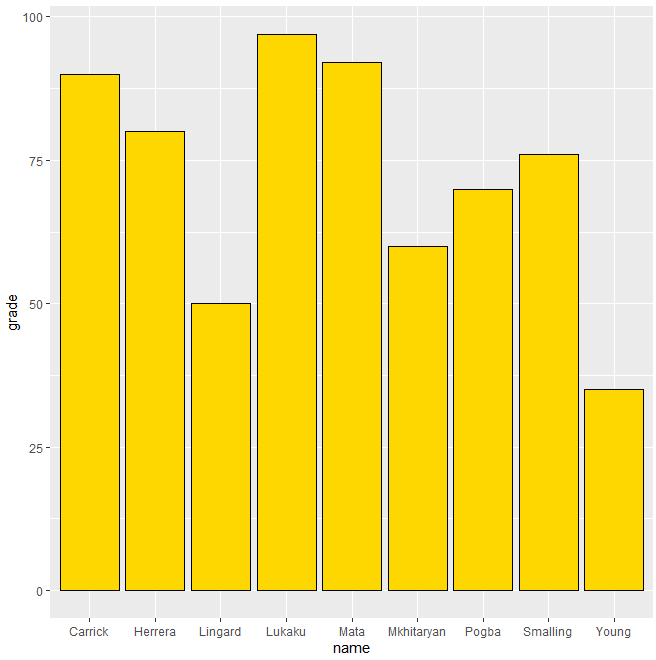
# colour : 테두리선 ggplot(x,aes(x=name,y=grade))+ |
 |
1.3 theme() : 그래프 테마 설정 변경
|
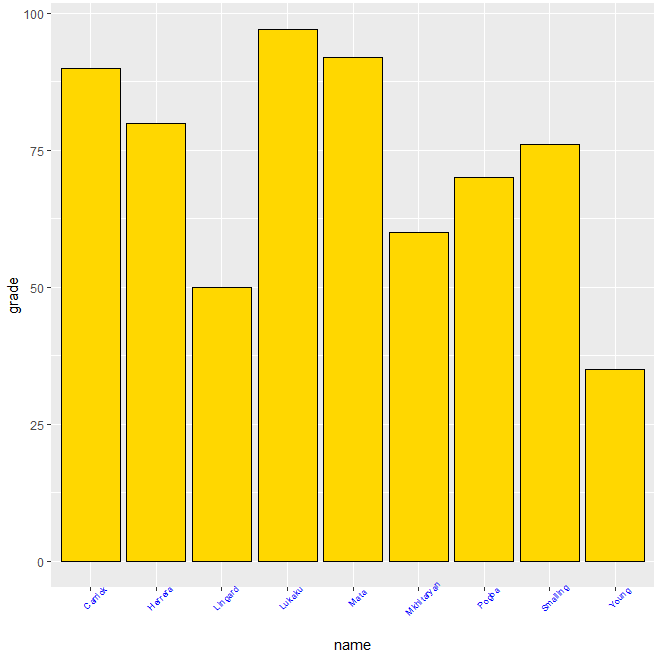
# theme(axis.text.x= ) : x축의 테마 변경 ggplot(x,aes(x=name,y=grade))+ |
 |
|
# element_text(colour= ) : 텍스트 색깔 변경 ggplot(x,aes(x=name,y=grade))+ |
 |
|
# element_text(size= ) : 텍스트 크기 변경 ggplot(x,aes(x=name,y=grade))+ size=7)) |
 |
|
# element_text(hjust= ) : 텍스트 정렬 위치 ggplot(x,aes(x=name,y=grade))+ |
 |
|
# element_text(vjust= ) : 표와 텍스트 사이 거리 조절 ggplot(x,aes(x=name,y=grade))+ |
 |
|
# theme(axis.text.y= ) : y축 테마 변경 ggplot(x,aes(x=name,y=grade))+
|
 |
1.4 축 정보 수정
|
# 요일별 입사한 인원수 데이터 library(plyr) week_cn <- count(emp,"wday(HIRE_DATE,week_start=1)") week_cn colnames(week_cn) <- c("week","cn") |
 |
|
# factor를 사용하지 않아서 x축 값이 듬성듬성나옴 ggplot(week_cn,aes(x=week,y=cn,fill=week))+ geom_bar(stat="identity") |
 |
|
# scale_x_continuous() : x축의 값 표시 ggplot(week_cn,aes(x=week,y=cn,fill=week))+ geom_bar(stat="identity")+ scale_x_continuous(breaks=seq(1,7,1)) |
 |
|
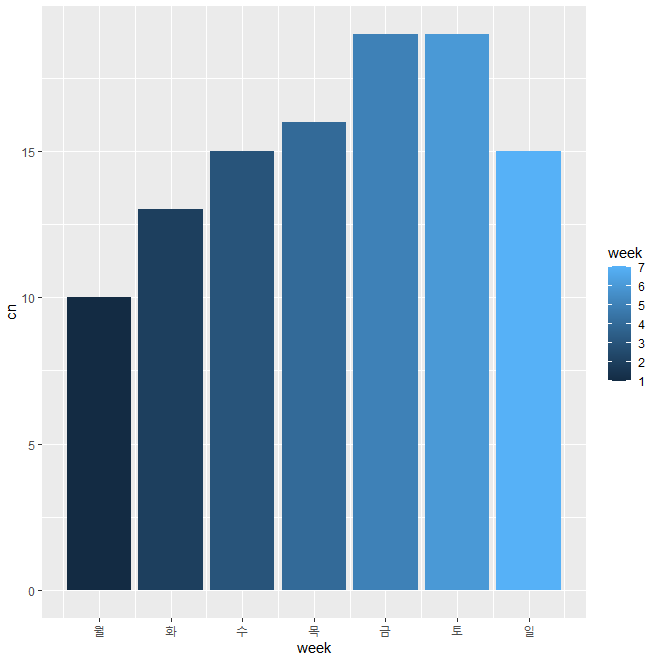
# x축의 정보 바꿈 ggplot(week_cn,aes(x=week,y=cn,fill=week))+ geom_bar(stat="identity")+ scale_x_continuous(breaks=seq(1,7,1), labels=c("월","화","수","목","금","토","일")) |
 |
|
# 범례 바꾸기 x11() ggplot(week_cn,aes(x=week,y=cn,fill=week))+ geom_bar(stat="identity")+ scale_x_continuous(breaks=seq(1,7,1), labels=c("월","화","수","목","금","토","일"))+ scale_fill_continuous(name="요일", labels=c("월","화","수","목","금","토","일")) |
 |
2. 스택형 막대그래프
2.1 geom_bar() : 막대그래프 그리기
|
# 파일 불러오기 및 변수에 저장 df <- read.csv("C:/data/exam.csv",header=T, |
 |
|
# ggplot(fill= ) : 이름을 기준으로 과목들의 점수 측정 ggplot(df,aes(x=name,y=grade,fill=subject))+ |
 |
2.2 geom_text : 그래프에 텍스트 넣기
|
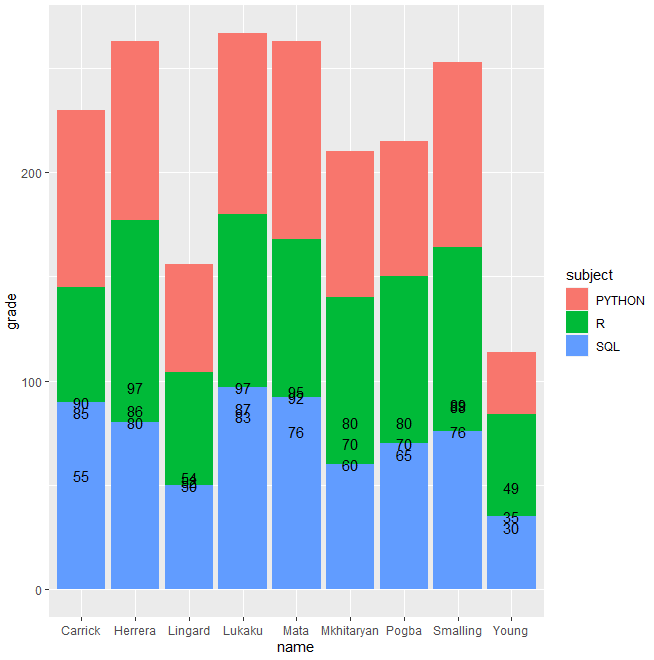
# geom_text(aes( )) : 그래프 안에 텍스트 넣기 ggplot(df,aes(x=name,y=grade,fill=subject))+ |
 |
|
# geom_text(position= ) : 글자 위치 지정 ggplot(df,aes(x=name,y=grade,fill=subject))+ |
 |
|
# geom_text(col= ) : 글자 색깔 지정 ggplot(df,aes(x=name,y=grade,fill=subject))+ |
 |
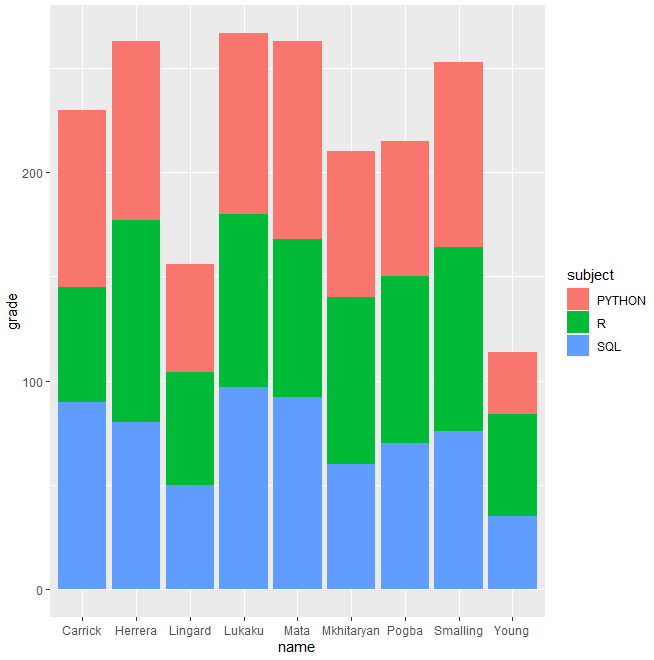
2.3 geom_col(position="stack") : 스택형 막대그래프 그리기
|
# geom_col(position= ) : 그래프 형태 지정 x11() |
 |
|
# geom_text() : 그래프 안에 텍스트 넣기 ggplot(df,aes(x=name,y=grade,group=subject))+ |
 |
| ggplot(df,aes(x=name,y=grade,group=subject))+ geom_col(aes(fill=subject),position="stack")+ geom_text(aes(label=grade), position=position_stack(vjust=0.5))+ theme(axis.text.x=element_text(angle=45, colour="blue",size=10, hjust=1,vjust=1)) |
 |
3. 그룹형 막대그래프
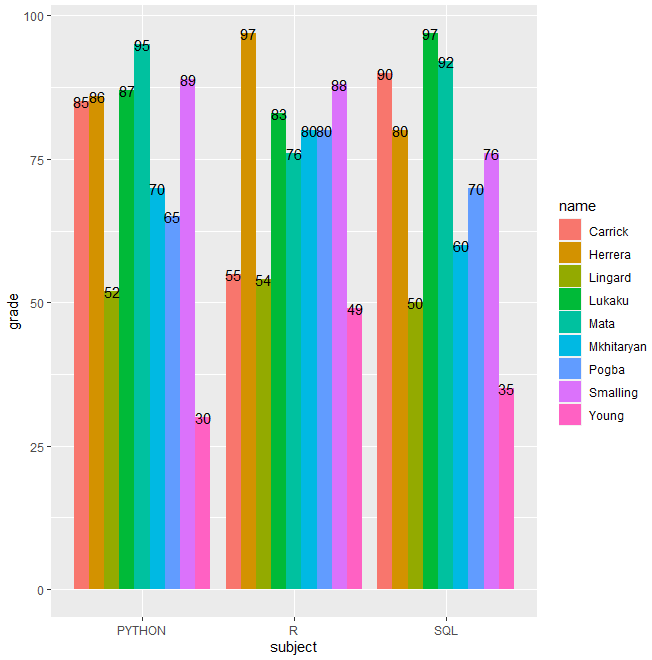
3.1 geom_col(position="dodge") : 그룹형 막대그래프 그리기
|
# 그룹형 막대그래프 그리기 ggplot(df,aes(x=name,y=grade,group=subject))+ |
 |
|
# x축, y축 바꿔서 출력 x11() |
 |
'컴퓨터 > R' 카테고리의 다른 글
| R - wordcloud (0) | 2020.04.23 |
|---|---|
| R - 시각화 ⑤ ggplot 라이브러리 사용(히스토그램, 상자그림) (0) | 2020.04.23 |
| R - 시각화 ③ box plot, Stem and Leaf Diagram (0) | 2020.04.22 |
| R - cut (0) | 2020.04.21 |
| R - 시각화 ② scatter plot, histogram (0) | 2020.04.21 |