들어가기 전에...
|
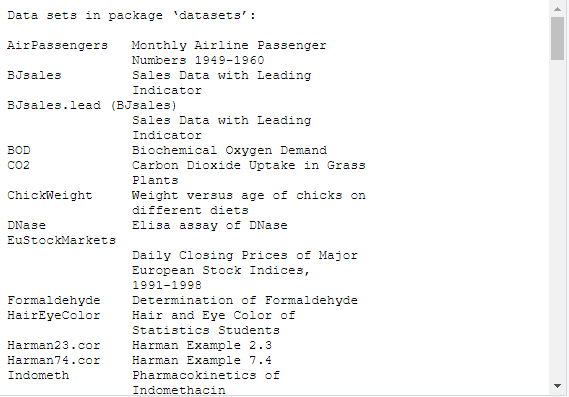
# R에서 제공하는 기본 데이터 확인 data() |
 |
|
# R에서 제공한 women 데이터 확인 women |
 |
1. 삼전도(scatter plot)
- 주어진 데이터를 점으로 표시해 흩뿌리듯이 시각화한 그래프
- 데이터의 실제값들이 표시 되므로 데이터의 분포를 한눈에 살펴보는데 유용하다.
- x-y plotting
|
type p : 점 l : 선 b : 점,선 o : 점위의 선 h : 수직선 s : 계단형 n : 나타나지 않음 |
lty : 선의 유형 (1~6) 0 : 그리지 않음 1 : 실선(기본값) 2 : 대시 3 : 점 4 : 점과 대시 5 : 긴 대시 6 : 두 개의 대시 |
lwd : 선의 굵기 |
|
# 기본 사용법 plot(women) |
 |
|
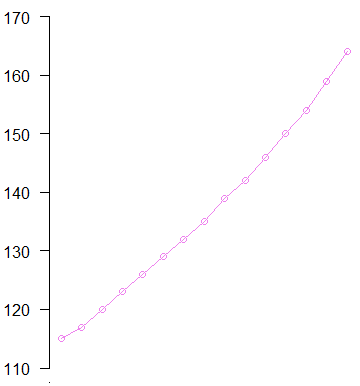
# 컬럼을 지정해서 출력 plot(women$height) |
 |
|
# 여러가지 옵션 사용해보기 plot(x=women$height, y=women$weight, |
 |
|
# 자동으로 축 표시 plot(women$weight, |
 |
|
# 축 직접 표시하기 plot(women$weight,
|
 |
|
# 축의 라벨을 직접 써주려면 x축,y축을 지정해서 그리면 안된다. plot(x=women$height, y=women$weight,
|
 |
|
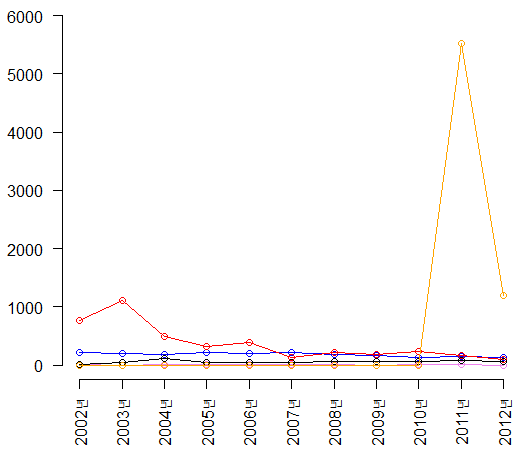
# 다른 그래프 겹쳐서 그리기 disease <- read.csv("C:/data/1군전염병발병현황_년도별.csv",header=T, stringsAsFactors=F) plot(disease$콜레라, type='o', lwd=1, xlab="", ylab="",col='violet', ylim=c(0,6000),axes=F) axis(1,at=1:11,labels=disease$년도별, las=2) axis(2,las=1) lines(disease$장티푸스,col="blue",type="o") lines(disease$이질,col="red",type="o") lines(disease$대장균,col="black",type="o") lines(disease$A형간염,col="orange",type="o") |
 |
|
# 눈금선 추가 # 범례 추가 |
 |
2. 히스토그램(histogram)
- 자동으로 빈도수가 체크된다.
|
# 기본 사용법 x <- c(10,20,30,50,17,25,36,
|
 |
'컴퓨터 > R' 카테고리의 다른 글
| R - 시각화 ③ box plot, Stem and Leaf Diagram (0) | 2020.04.22 |
|---|---|
| R - cut (0) | 2020.04.21 |
| R - 시각화 ① pie chart, bar graph (0) | 2020.04.20 |
| R - 분할표 만들기 (0) | 2020.04.20 |
| R - grep과 정규표현식 (0) | 2020.04.17 |