
histogram
- 자료가 모여 있는 위치나 자료의 분포에 관한 대략적인 정보를 한눈에 파악할 수 있는 장점은 있으나 구체적인 수치정보를 쉽게 알아볼수없는 단점이 있다.
- 예) ages=[21,24,26,27,29,31,37,39,40,42,45,50,51,59,60,68]

1. List 형식
# 키에 관한 데이터 (이산형 데이터)
height = [157,163,180,162,186,178,173,152,156,184,170,171,172]
type(height)

1) 도수분포표로 만들기
# 분할 구간 만들기 (150~160, 160~170, 170~180, 180~190)
bins = [150,160,170,180,190]
# pd.cut(객체, 구간, 구간 기준)
# 구간 기준 기본값은 True
blood_cut = pd.cut(height,bins,right=True) # 150 < height <= 160
blood_cut
pd.value_counts(blood_cut)

bins = [150,160,170,180,190]
blood_cut = pd.cut(height,bins,right=False) # 150 <= height < 160
blood_cut
pd.value_counts(blood_cut)

# 인덱스 이름 사용 및 정렬
bins = [150,160,170,180,190]
label = ['150대','160대','170대','180대']
blood_cut = pd.cut(height,bins,right=True, labels=label)
pd.value_counts(blood_cut).sort_index()

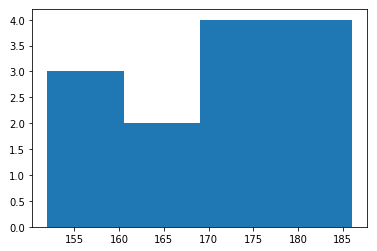
2) 히스토그램 만들기
# 기본형
# plt.hist(객체, 구간)
bins = [150,160,170,180,190]
plt.hist(height, bins = bins)

# 분할 구간의 개수를 지정해서 나누기
plt.hist(height, bins = 4)
# 구간을 자동으로 분할하기
plt.hist(height, bins = 'auto')

# 막대 넓이 조절
plt.hist(height, bins = 'auto', rwidth = 0.8)

2. ndarray 형식
한달 독서량 (book)
book = [[1,2,8,13,9,4],
[5,19,9,5,11,3],
[2,3,8,4,15,6]]
book = np.array(book)
book

|
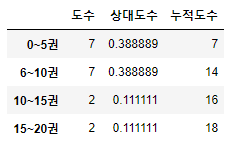
도수분포표 만들기
# array 형태를 1차원 배열로 바꾸기 book.shape # (3, 6)
# 도수분포표 데이터프레임 형식으로 만들기 bins = list(range(0,21,5)) |
 |
|
히스토그램 만들기
plt.hist(weight, bins = bins,rwidth = 0.8,color='red') |
 |
3. DataFrame 형식
키 (height)
height = pd.read_csv("C:/data/height.csv",header = None)
height

|
도수분포표 만들기
# DataFrame 형태를 1차원 배열로 바꾸기 height.shape # (1,24)
# 1차원 배열로 바꾸기 이렇게도 가능 np.array(height).shape # (24,1) height = np.array(height).reshape(24,) # (24, )
# 도수분포표 데이터프레임 형식으로 만들기 bins = list(range(150,191,10)) height_cut = pd.cut(height,bins,right=True) |
 |
|
히스토그램 만들기
plt.hist(height, bins = bins,rwidth = 0.8,color='blue') |
 |
'컴퓨터 > 파이썬' 카테고리의 다른 글
| 파이썬(Python) - 정규표현식과 메타문자 (0) | 2020.03.24 |
|---|---|
| 파이썬(Python) - matplotlib ③ 상자 그림 / 줄기잎 그림 (0) | 2020.03.24 |
| 파이썬(Python) - matplotlib ① pie chart / bar chart / line plot (0) | 2020.03.22 |
| 파이썬(Python) - 파이썬에서 오라클 SQL로 접속하는 방법 (0) | 2020.03.19 |
| 파이썬(Python) - Sqlite 사용법 (0) | 2020.03.17 |